
With all the focus and “hubbub” on network and data security, it becomes very easy for any organization to view a tool like Splunk as solely a security platform. Why wouldn’t they? The Splunk Enterprise Security platform, as well as the newer User Behavior Analytics (UBA) engine, can drastically increase any organization’s overall security posture, whether security monitoring has been an overarching concern for that organization or is a relatively new topic. Protecting an organization’s data – and more importantly THEIR CUSTOMER’S data — is a critical concern from any entity’s perspective, and one that many organizations have failed recently to achieve. Target’s credit card breach, the U.S. Office of Personnel Management (OPM) data breach, Home Depot’s credit card breach…the list goes on and on.
Hence, it becomes a no-brainer to use a platform like Splunk, with its Universal Machine Data mentality, to continuously monitor an organization’s network to detect breaches and attacks the moment they happen, not days (or months in some cases!) after the fact. Heck, even the United States Department of Homeland Security has selected Splunk as one of the chosen tools for its multi-year government-wide Continuous Diagnostics and Mitigation (CDM) program.
Security is one of the major use cases for Splunk, and it is one of the major and continuous use cases we see here at GTRI with all our clients, from the smallest commercial entities, to the largest enterprises, and most so with our Federal Government customers. As such, it’s somewhat easy to forget what Splunk is truly intended to be viewed and deployed as — the Platform for Machine Data. Data from machines collected in Splunk is valid AND valuable for countless use cases stretching outside the bounds of network security.
Meet Splunk ITSI: Your New Best Friend
Recently Splunk introduced another fantastic premium application into their arsenal of already world-class and robust offerings (including Enterprise Security) – Splunk Information Technology Service Intelligence (ITSI).
I was one of the few fortunate enough to be introduced and certified in the installation and customization of ITSI long before it was released to the public. Most of our clients today that have a current Splunk installation in place have been introduced to ITSI one way or another, either through Splunk directly or through us providing regular check-ins with our customers. For those who are new to it, the Splunk ITSI application provides valuable and meaningful machine-data-driven insight into an organization’s key performance indicators and services. And when we say services, we mean literally anything from a technical or business perspective that is relevant to your organization.
Now, I know what you’re thinking: “Yeah, yeah, Taylor, we’ve heard about ITSI, but Splunk is our security tool.” Many of our clients that currently use Splunk have a single, sometimes double use case for Splunk within the realms of security, audit and accountability, or even inventory. And while these are all very viable use cases for the Splunk engine, an organization’s operations and overall service uptime is always a mission-critical consideration, whether we’re talking about a mom and pop shop or the United States Department of Defense.
That’s why the ITSI application should be in your Splunk wheelhouse. Here’s a few of the services you can track with ITSI:
Technical Services
- DNS and DHCP services
- Layer 2 and Layer 3 services
- Web Application services
- Database services
Business Services
- Transactions occurring per second/minute/etc.
- Incoming revenue
- Customers on your website
- Anything an APM tool can measure
Services can be as narrow or as broad as your organization may deem appropriate, but one thing holds true for all services in that they are all driven by underlying Key Performance Indicators (KPIs). For example, a web application service will have several KPIs that “feed” the overall health of the operational service: CPU usage, memory usage, network latency, etc. The more relevant KPIs that can be collected and viewed by Splunk, the more accurate and substantial an overall service’s health score will be. And just to put “rubber to the road” with some Splunk lingo, a KPI in terms of Splunk is a simple Splunk query or search.
What the ITSI application and engine brings to the equation is the ability to calculate an overall services health score based on the results of these search queries (KPIs) related to their individual urgencies and weights. What it also provides are new ways to visualize query results and services altogether that expand well beyond the visualization capabilities we see simply with the core Splunk platform. These include Service Analyzer (Figure 1 below), End to End Health (e.g., glass tables, Figure 2 below), and Deep Dives (Figure 3 below).
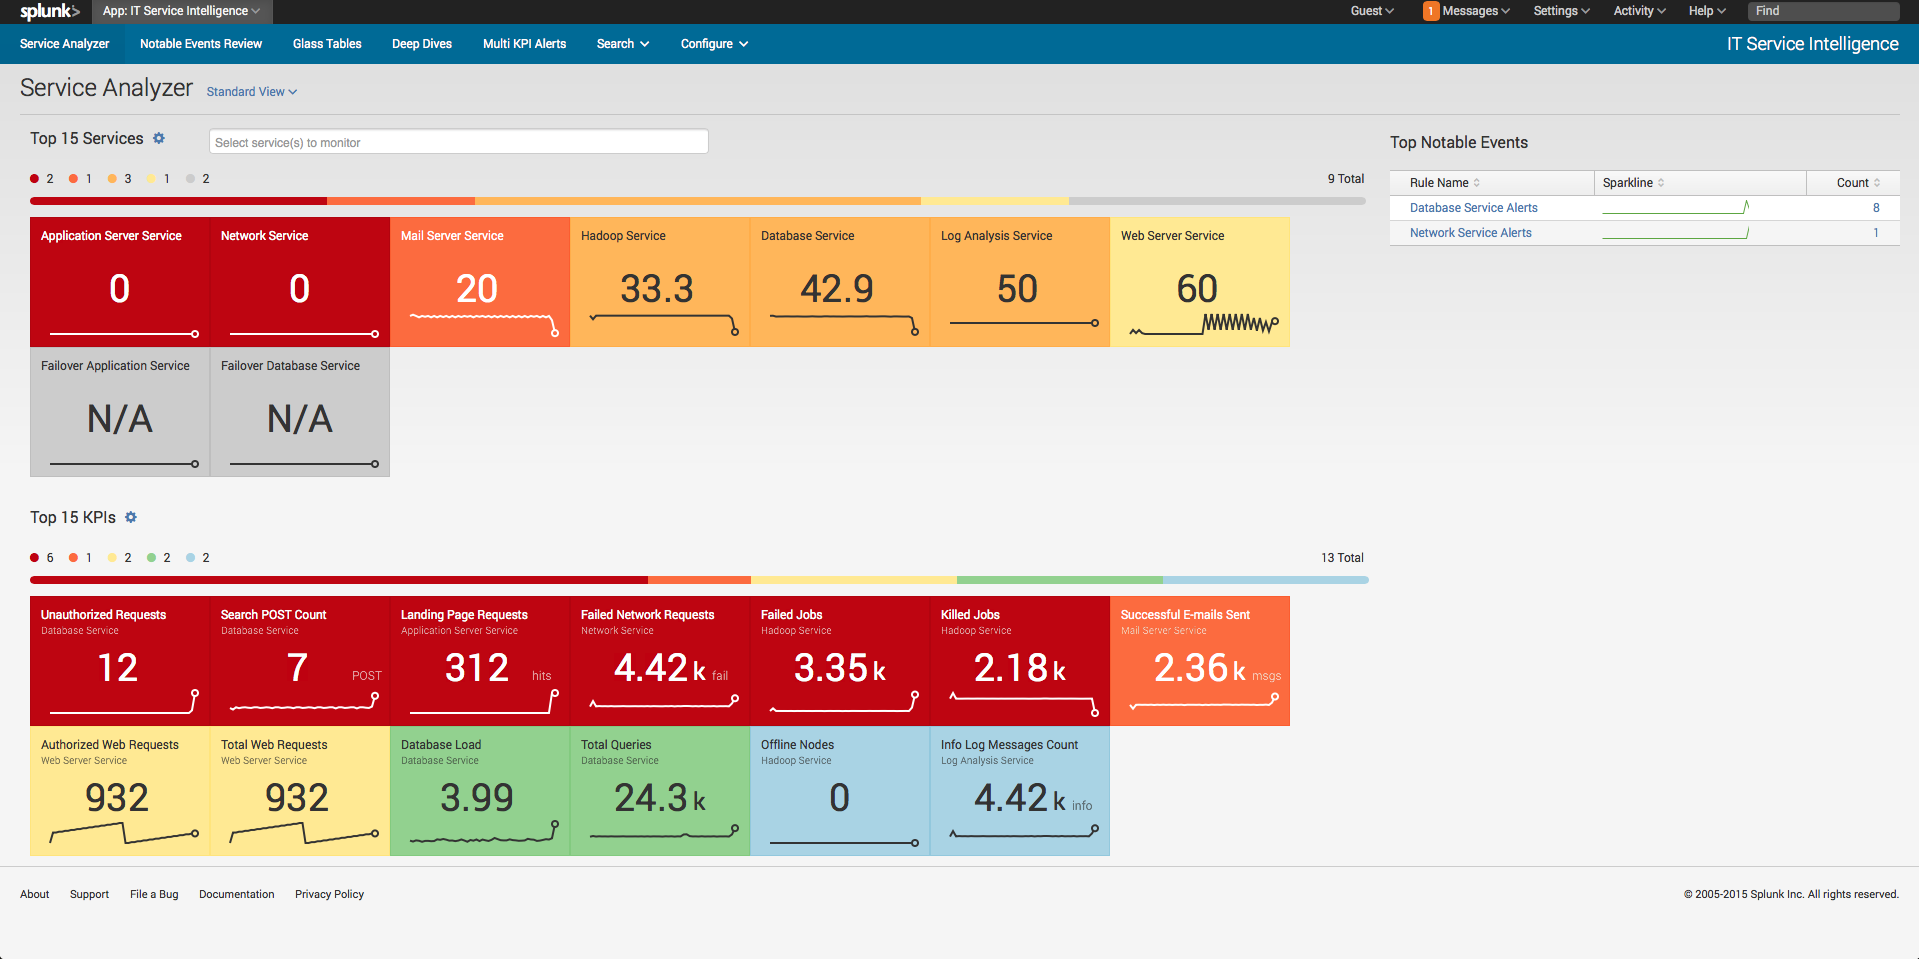 Figure 1 – Splunk ITSI Service Analyzer
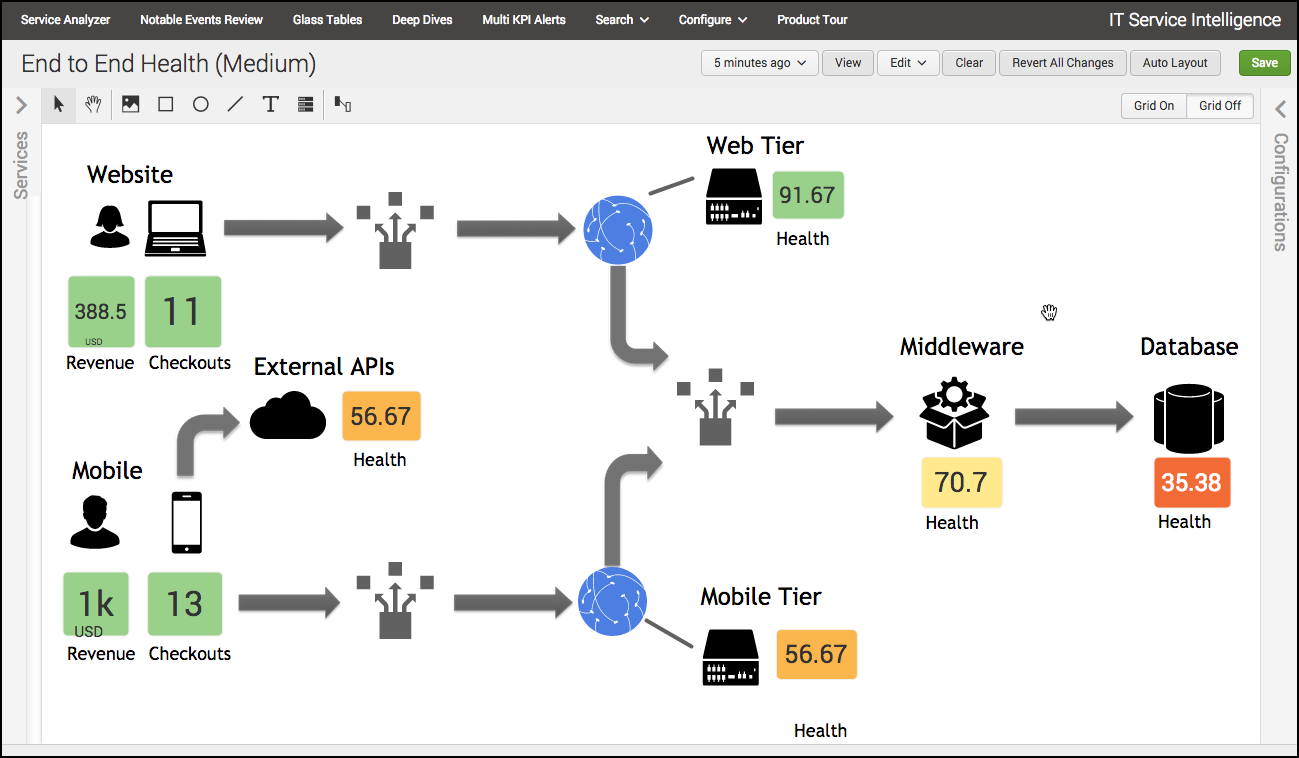 Figure 2 – Splunk ITSI End-To-End Health
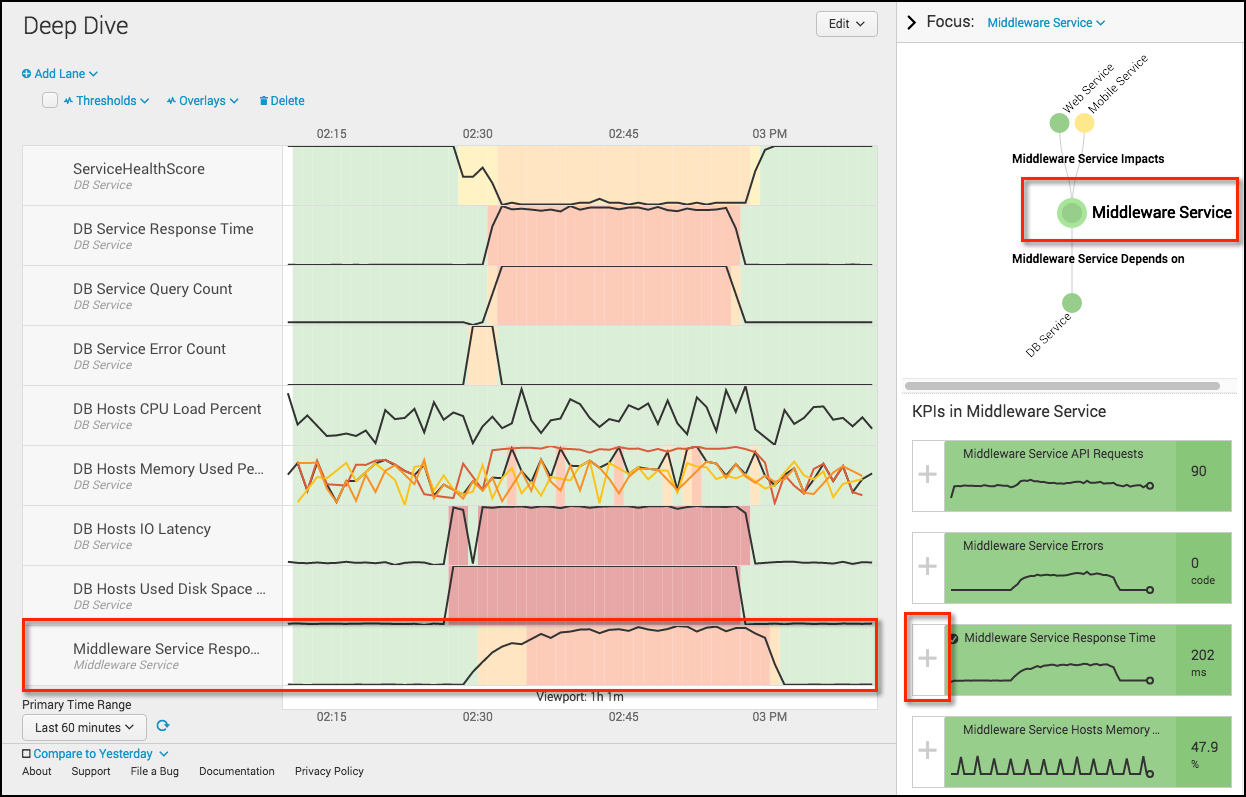 Figure 3 – Splunk ITSI Deep Dive
Each of these provides the user a real-time and historical means of viewing not only a service or a KPI’s individual posture at any given time, but also the ability to view how services and/or KPI’s interact with each other across the organization’s infrastructure. This lets the user investigate and resolve operational issues rapidly without the need for various silos of the organization pointing fingers at each other when a service goes down. As an example, using a glass table built showing the layout of a web store, I can visualize that my database service has gone red, causing all other services of my webstore to deteriorate. As the user, I can view the individual KPI’s of my database service, determine which KPI is responsible for the decline in service health score, and push the resolution to the database team to have the webstore operations reinstated.
While the Splunk ITSI application is fantastic in that it provides a means for an organization to view its operational postures at any given time, like Splunk’s Enterprise Security application it is a platform that must be tailored and customized to the entity’s specific needs and use cases. In order to be successful in the installation of the application, as well as get immediate value once the application is handed off to users, a variety of considerations must be looked at prior to installation. These include: “What are my services?”, “What are the KPIs of that service?” and “What are the machines responsible for these KPIs?”
In a future blog, I will be diving much deeper into these considerations for those of you who are interested in looking at Splunk ITSI further. For now, my intention here is to introduce the application to those that are new to it, and to open or broaden the horizon of those that simply view Splunk as a security tool.
And that statement really brings this blog full circle. Why did I start with such a security focus and transition into Splunk for operational awareness and service intelligence? It’s to reinforce the idea and concept that has truly, in my opinion, made Splunk the standalone solution in the industry today…The Platform for Machine Data. Splunk can ingest machine data from virtually endless point sources, many of which provide insightful information for many use cases beyond a network or data security use case. Sure, you want to monitor when an outside entity performs a successful brute force attack on a webserver with the potential to steal confidential customer data. But that same server can be operationally monitored for CPU, memory, disk, and other metrics to ensure the physical uptime of the website remains intact. And this concept is what I not only want you to take away from this blog, but what I and others here at GTRI enforce with our Splunk clients. All data is relevant for any number of use cases. A platform that is universally designed for any type of data and use case, such as Splunk, can provide that single pane of glass for any number of use cases present within the organization.
Thank you so much for taking the time to read this and I surely hope it provides a new view of the capabilities of Splunk for those who are new to the platform, and a broader view to those who are more seasoned. Like I said before, there will be more to come from me specifically related to ITSI and the critical considerations necessary for value and success with the application. But for now, I leave you with hopefully plenty to ponder. And as always, happy Splunking!
Taylor Williams is a Solutions Architect of the Big Data Practice at GTRI.