
In the last couple posts on this topic, Micah Montgomery gave an overview of getting data into Splunk, and Scott DeMoss gave an overview of getting data out of Splunk. In this post, I am going to go “outside the box” and cover how to use Splunk scripted inputs to get data from atypical sources into Splunk.
Typically, data is sent to Splunk using the Splunk Universal Forwarder or syslog. What happens if you have a device that does not support either of these means? No worries, you can still Splunk it!
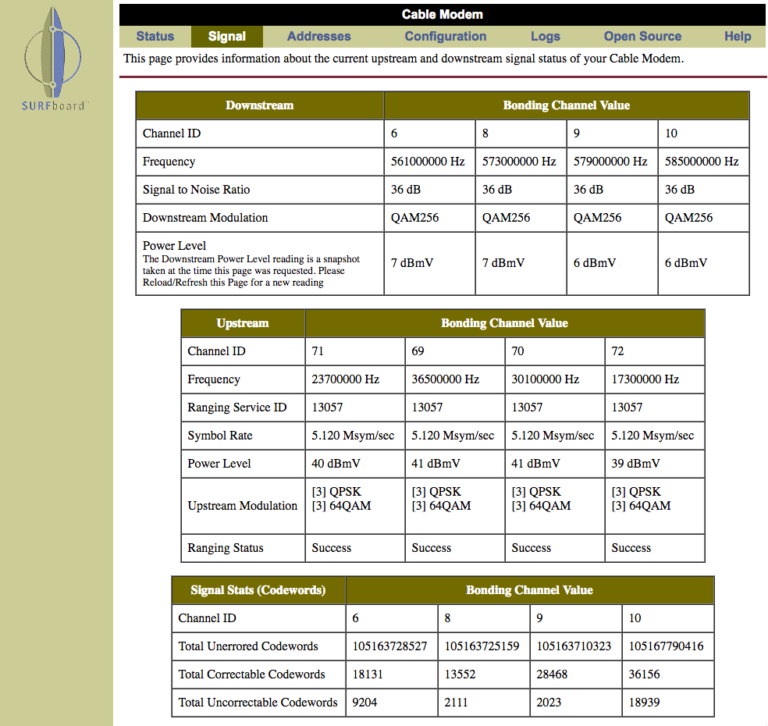
Last month I completed Splunk’s Certified Sales Engineer II certificate. One of Splunk’s requirements is to onboard a new data source into Splunk. I wanted to have a little fun with this and Splunk my Motorola Surfboard modem. (You may have one of these modems in your house since they are very common for cable Internet service.) The only way to obtain information from these devices is by using the web interface typically available at http://192.168.100.1 on your home network. There are two important sets of data available: Signal (figure 1) and Logs (figure 2).
 Figure 1: Web Interface – Signal
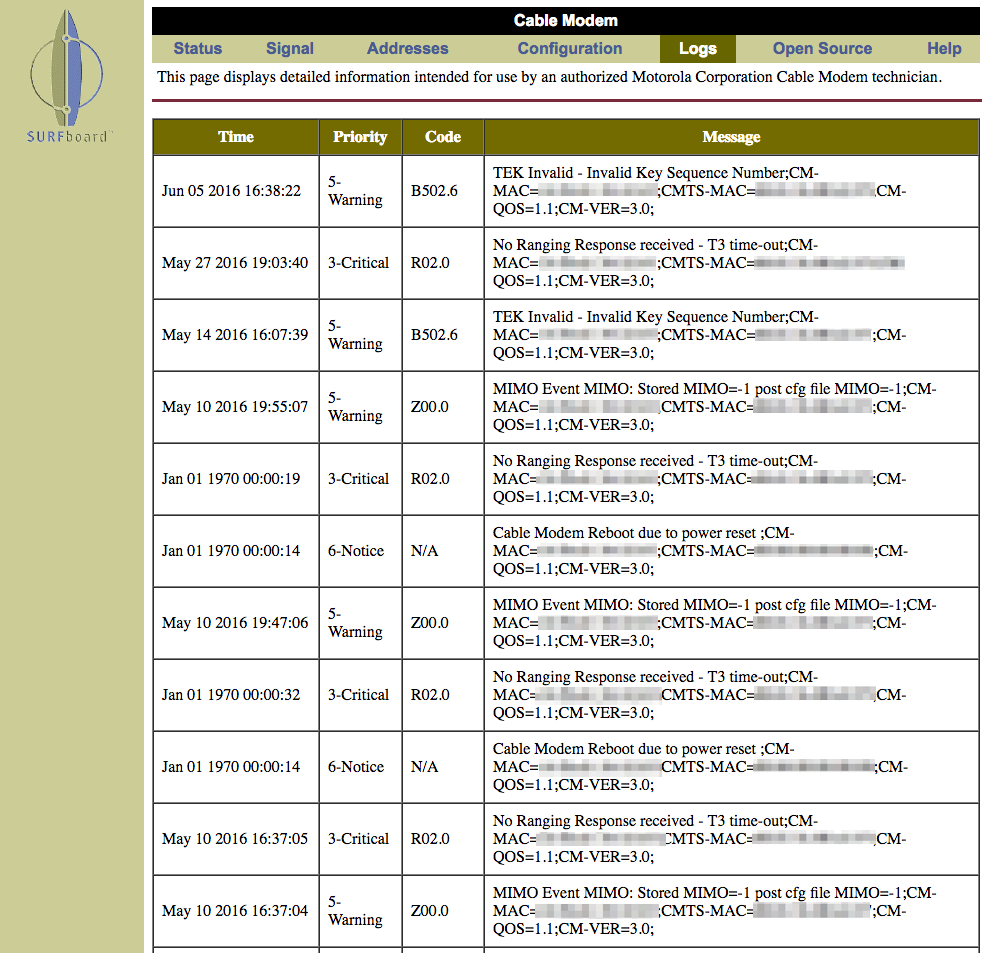 Figure 2: Web Interface – Logs
You may be asking yourself, how can I Splunk this? Splunk allows you to use scripted inputs to collect data using different scripts such as Python, Bash, PowerShell, etc. You can write a script to collect data from any source — the only limitation is your programming skills! Splunk will index the data as long as you send it to stdout. In this case, sending data to stdout is as easy as having your program print the data to the screen.
In my example, to collect the signal information I wrote a Python script that requests the signal URL (http://192.168.100.1/cmSignal.htm) and parses the HTML using Python’s Beautiful Soup library. This library provides some easier ways to parse HTML tables than using string manipulation or regular expression. I used Javascript Object Notation (JSON) for my output since Splunk automatically extracts fields when using JSON or key=value notation, and JSON is both human and machine readable (figure 3).
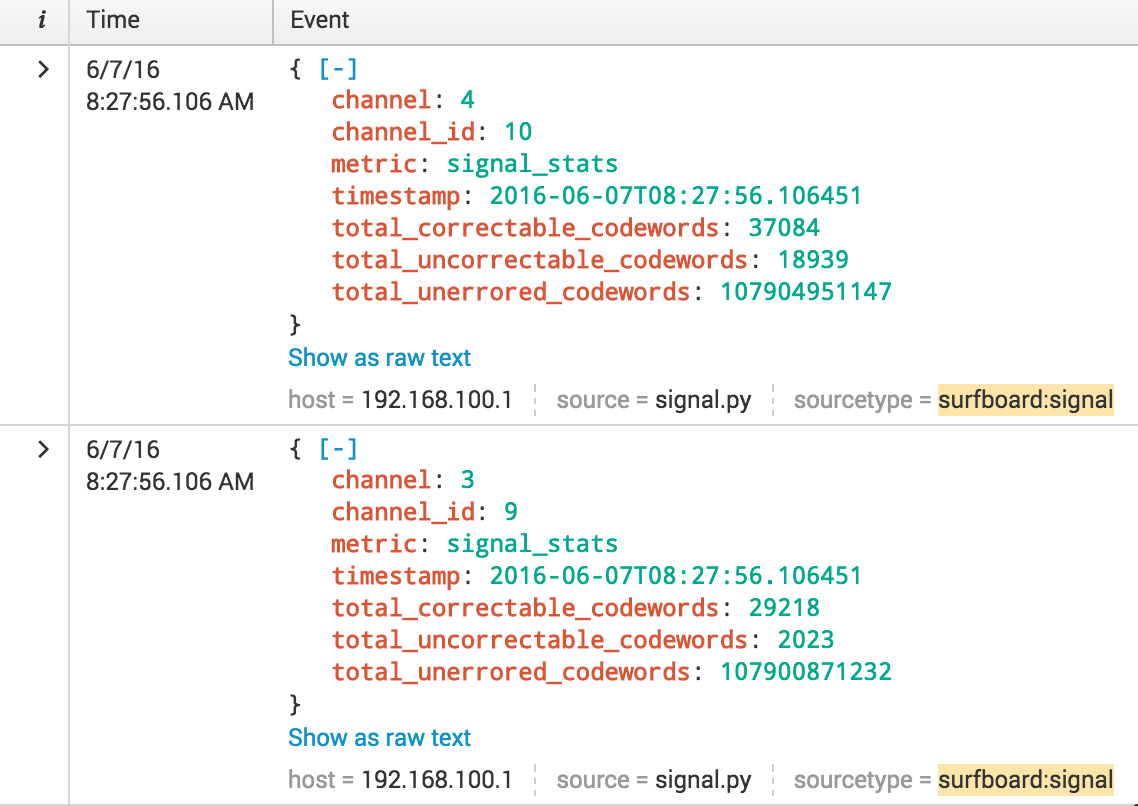 Figure 3: Signal
Writing a script to parse the Logs page was a little more challenging. Since I was pulling logs from different time periods, I needed to keep track of the last log that was indexed into Splunk. If you’ve noticed in figure 2, some of the timestamps are from “Jan 01 1970”. This is due to the fact that when there is a power loss, the modem loses its time. Since there is no battery or internal clock, time is synced from the cable modem termination system (CMTS) when starting up.
To address this situation, I wrote a Python script that requests the Log URL (http://192.168.100.1/cmLogs.htm) and again parses the HTML using Python’s Beautiful Soup library. I joined the time, priority, code and message fields into a single message (figure 4). In order to prevent Splunk from double-indexing messages, my script records the last received timestamp that is not from “Jan 01 1970” to a flat file and only sends logs to Splunk with a timestamp that is greater than the previous timestamp event. If an event from “Jan 01 1970” occurs after this previous timestamp it will also be indexed, but with the timestamp of the previous event (figure 5). Splunk detects that the event occurred outside the MAX_DAYS_AGO parameter and uses the previous event’s timestamp.
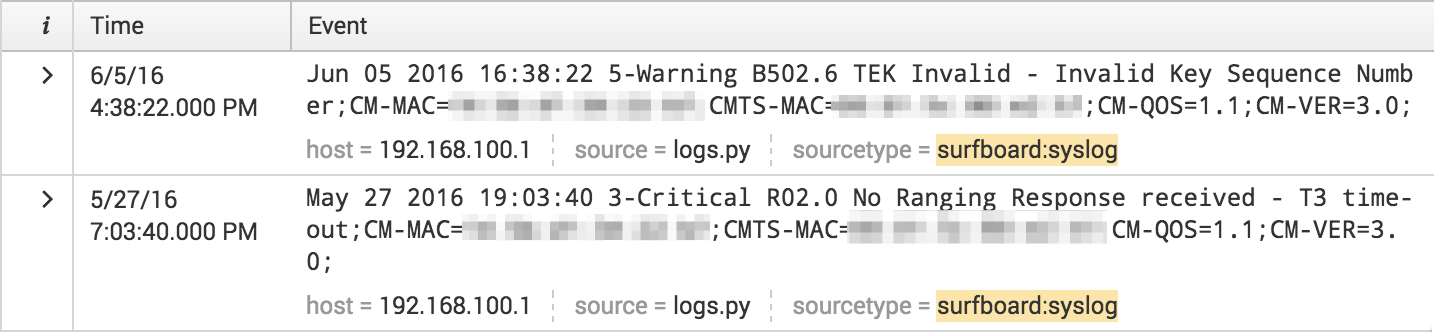 Figure 4: Logs
 Figure 5: Time parsing
Now that I had my modem data in Splunk, I decided to index weather data. There are a couple apps available on Splunkbase, but I decided to write my own scripted input.
Splunk loves machine data and the one attribute that makes machine data unique is the timestamp. Every event Splunk indexes has a _time field. Using the timestamp, Splunk can easily correlate unrelated events such as modem signal levels and humidity. Single events may seem interesting, but a whole new world opens up when different types of data are correlated. Below, I plotted my modem’s downstream power level versus humidity and was amazed at the close correlation (figure 6).
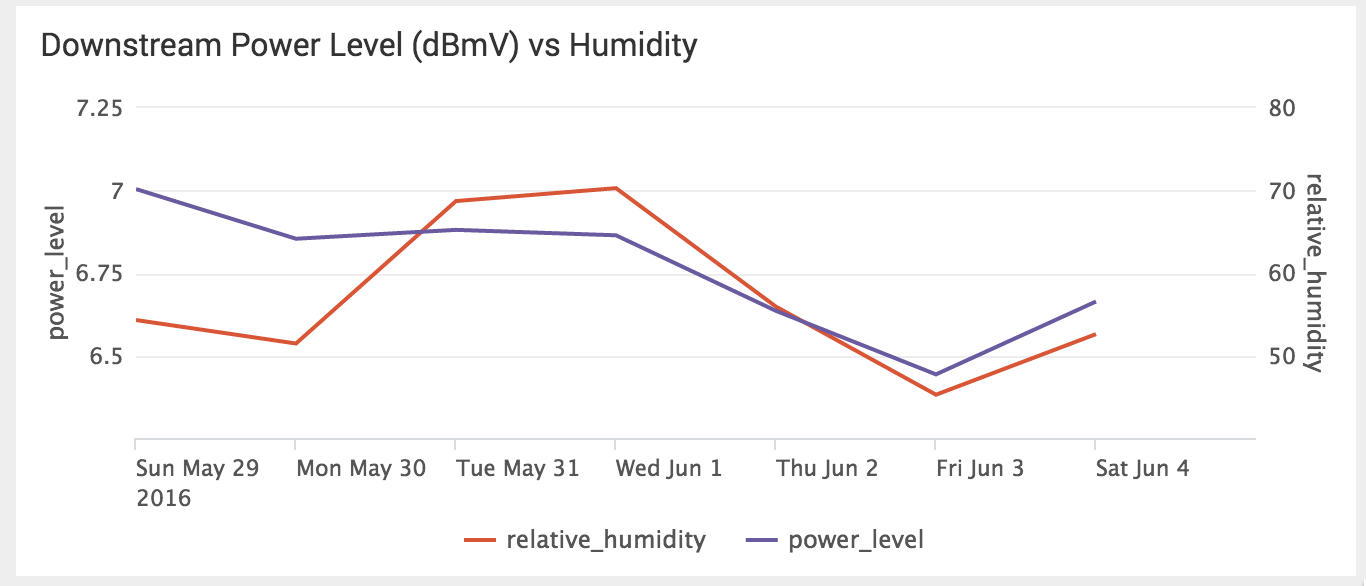 Figure 6: Downstream Power Level vs Humidity
After refreshing my knowledge of transmission line properties the correlation became clear. Humidity can enter a coaxial cable through termination, pin holes in the cable jacket, or vapor transmission through the cable jacket and cause two main effects on the cables. First, there is an increase in resistive loss from the oxidation of the braid, and, second, the increase of temperature as water is absorbed into the dielectric decreases the power level.
I then asked myself, “What happens to download and upload speeds as temperatures change?” I used another scripted input that performs a speedtest and indexes download and upload speeds and ping times. This correlation (figure 7) yields some interesting results: it appears that as the temperature increased above 75 degrees Fahrenheit, both download and upload speeds seem to decrease. Perhaps as it becomes too hot outdoors people go back inside and start binge watching Netflix? I bet the opposite occurs during the colder months, but we will have to wait and see!
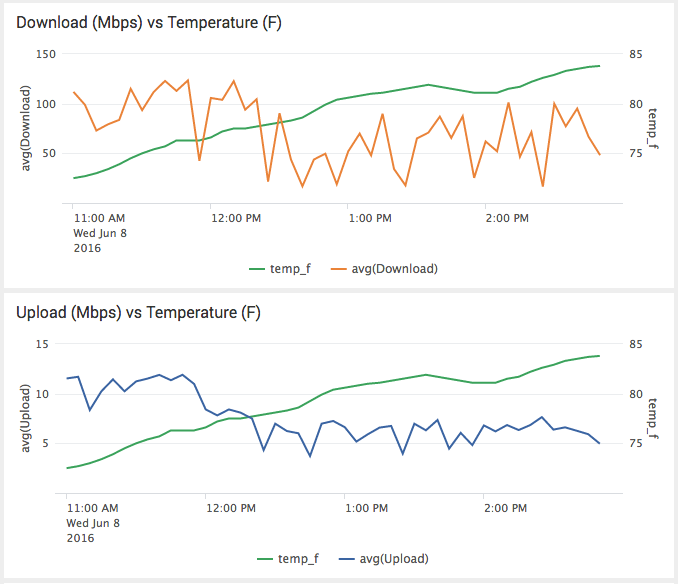 Figure 7: Bandwidth versus Temperature
Machine data is more than just logs; it contains a definitive record of all the activity and behavior of your customers, users, transactions, applications, servers, networks and mobile devices. It includes configurations, data from application program interfaces (APIs), the output of diagnostic commands, and sensor data. I was able to use Splunk to index machine data that was only available using a device’s web interface and correlate it with unrelated weather data. Machine data is unique as it typically takes the form of time-series events. Splunk is able to leverage the event’s timestamp and easily correlate unrelated events with ease — no longer do you need to worry about events having the same dimension.
I hope you enjoyed “Splunking Outside the Box” as much as I did. If you have not read my previous blog post on “Using Splunk Scripted Input beyond Data Collection,” I encourage you to do so if you want to learn how to use Splunk scripted inputs with a deployment server to perform remote maintenance, including replacing the default root certificate used in pre-6.3 Splunk Enterprise, Splunk Light and Hunk, which will expire on July 21, 2016.
Luke Netto is a Splunk Consulting Engineer with GTRI’s Professional Services team.